Thermodynamic Database
Components (13)
Total of 13 components are included in the database as listed here:
Major alloying elements Al, B, Cr, Hf, Mn, Mo, Re, Si, Ti
Minor alloying elements: C, Fe, O and Zr
Suggested Composition Range
The suggested composition range for each element is listed in Table 1. It should be noted that this given composition range is rather conservative. It is derived from the chemistries of the multicomponent commercial alloys that have been used to validate the current database. In the subsystems, many of these elements can be applied to a much wider composition range. In fact, some subsystems are valid in the entire composition range as given in Section Assessed Subsystems.
| Elements | Composition Range (wt.%) |
|---|---|
|
Mo |
50 ~ 100 |
|
Si, Ti |
0 ~ 30 |
|
B, Cr |
0 ~ 20 |
|
Al, Hf, Mn, O, Re |
0 ~ 10 |
|
C, Fe, Zr |
0 ~ 5 |
What is new in PanMo2024
Addition of the component O.
Phases
Total of 208 phases are included in the database and a few key phases are listed in Table 2. Information on all the other phases is listed in PanMo2024:List of All Phases. Users can also view it through TDB viewer of Pandat™ .
Assessed Subsystems
A total of 88 subsystems, including 61 binary and 27 ternary subsystems have been assessed. The modeling status is indicated by numbers. The systems with number 10 are fully assessed in the whole composition range. The higher value shows higher reliability of the system.
Binary Systems (61)
| Al-B(10) | Al-C(10) | Al-Cr(10) | Al-Fe(10) | Al-Hf(10) | Al-Mn(10) | Al-Mo(10) |
| Al-O(10) | Al-Re(10) | Al-Si(10) | Al-Ti(10) | Al-Zr(10) | B-Cr(10) | B-Fe(10) |
| B-Hf(10) | B-Mn(10) | B-Mo(10) | B-O(10) | B-Re(10) | B-Si(10) | B-Ti(10) |
| B-Zr(10) | Cr-Fe(10) | Cr-Hf(10) | Cr-Mn(10) | Cr-Mo(10) | Cr-O(10) | Cr-Re(10) |
| Cr-Si(10) | Cr-Ti(10) | Cr-Zr(10) | Fe-Hf(10) | Fe-Mn(10) | Fe-Mo(10) | Fe-O(10) |
| Fe-Re(10) | Fe-Si(10) | Fe-Ti(10) | Fe-Zr(10) | Hf-Mn(10) | Hf-Mo(10) | Hf-O(10) |
| Hf-Si(10) | Hf-Ti(10) | Hf-Zr(10) | Mn-Mo(10) | Mn-O(10) | Mn-Si(10) | Mo-O(10) |
| Mo-Re(10) | Mo-Si(10) | Mo-Ti(10) | Mo-Zr(10) | O-Re(5) | O-Si(10) | O-Ti(10) |
| Re-Si(10) | Re-Ti(10) | Si-Ti(10) | Si-Zr(10) | Ti-Zr(10) |
Ternary Systems (27)
| Al-C-Mo(10) | Al-Cr-Mo(8) | Al-Fe-Mn(6) | Al-Fe-Si(10) | Al-Mn-Si(10) | B-C-Mo(10) |
| B-Hf-Mo(10) | B-Mo-Re(10) | B-Mo-Si(10) | B-Mo-Zr(5) | B-Si-Ti(10) | C-Cr-Mo(10) |
| C-Fe-Mo(10) | C-Hf-Mo(10) | C-Mn-Mo(10) | C-Mo-Re(10) | C-Mo-Si(10) | C-Mo-Ti(10) |
| C-Mo-Zr(10) | Cr-Fe-Ti(10) | Cr-Mo-Ti(10) | Cr-Mo-Zr(10) | Fe-Mo-Si(10) | Hf-Mo-Si(10) |
| Mo-Re-Si(10) | Mo-Si-Ti(10) | Mo-Si-Zr(8) |
Database Validation
The current PanMo database was validated by large amounts of phase equilibrium data available for Mo alloys. A few examples are given here. Figure 1 shows the calculated liquidus projection of the Mo-Si-B ternary system. The calculated isothermal lines are also shown in the same figure.
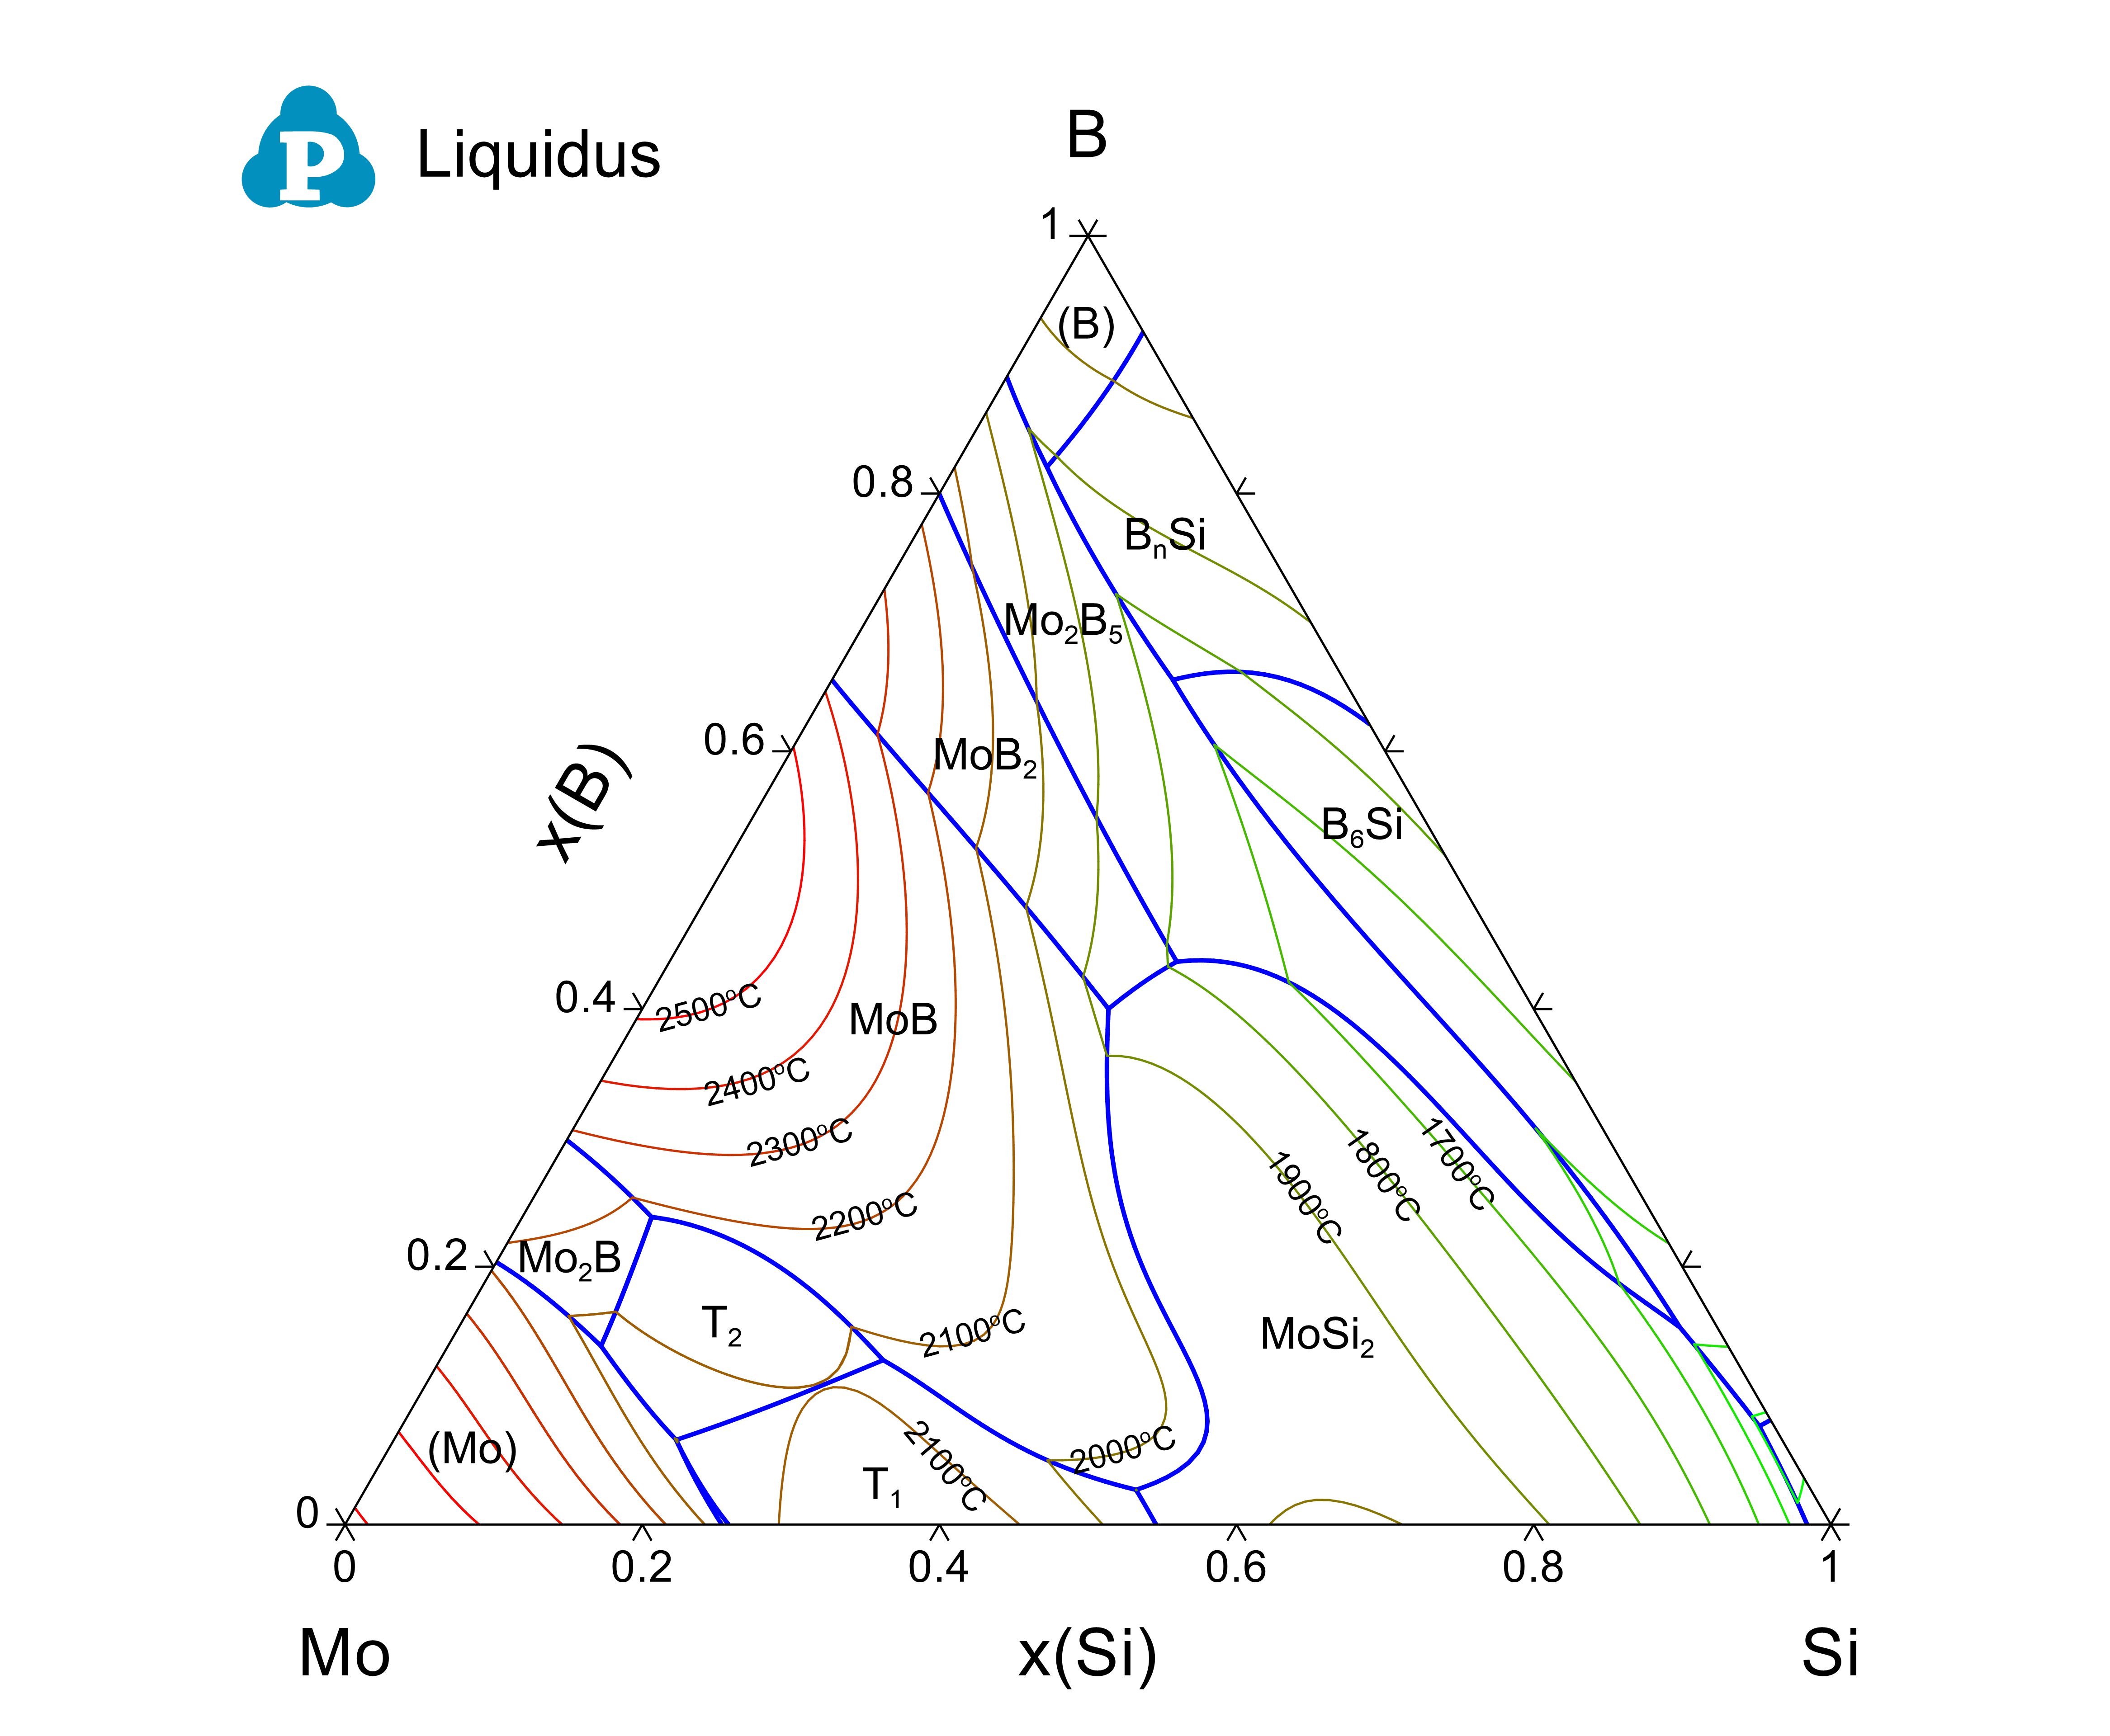
Figure 1: Calculated liquidus projection of the Mo-Si-B ternary system superimposed with the isothermal lines.
Figure 2 shows the calculated isothermal section of the Mo-Si-B ternary system at 1600 °C, which demonstrates the equilibrium between the ternary T2 phase and the binary phases.
Figure 3 and Figure 4 show the calculated isothermal sections of the Mo-Si-Ti ternary system with the experimental data of [2003Yan] at 1600 °C and 1425 °C, respectively. Blue lines are the calculated phase boundaries. Symbols are the phase equilibrium data measured using EPMA. It can be seen that the experimentally measured phase equilibrium data are in good agreement with the thermodynamic calculations using PanMo thermodynamic database.
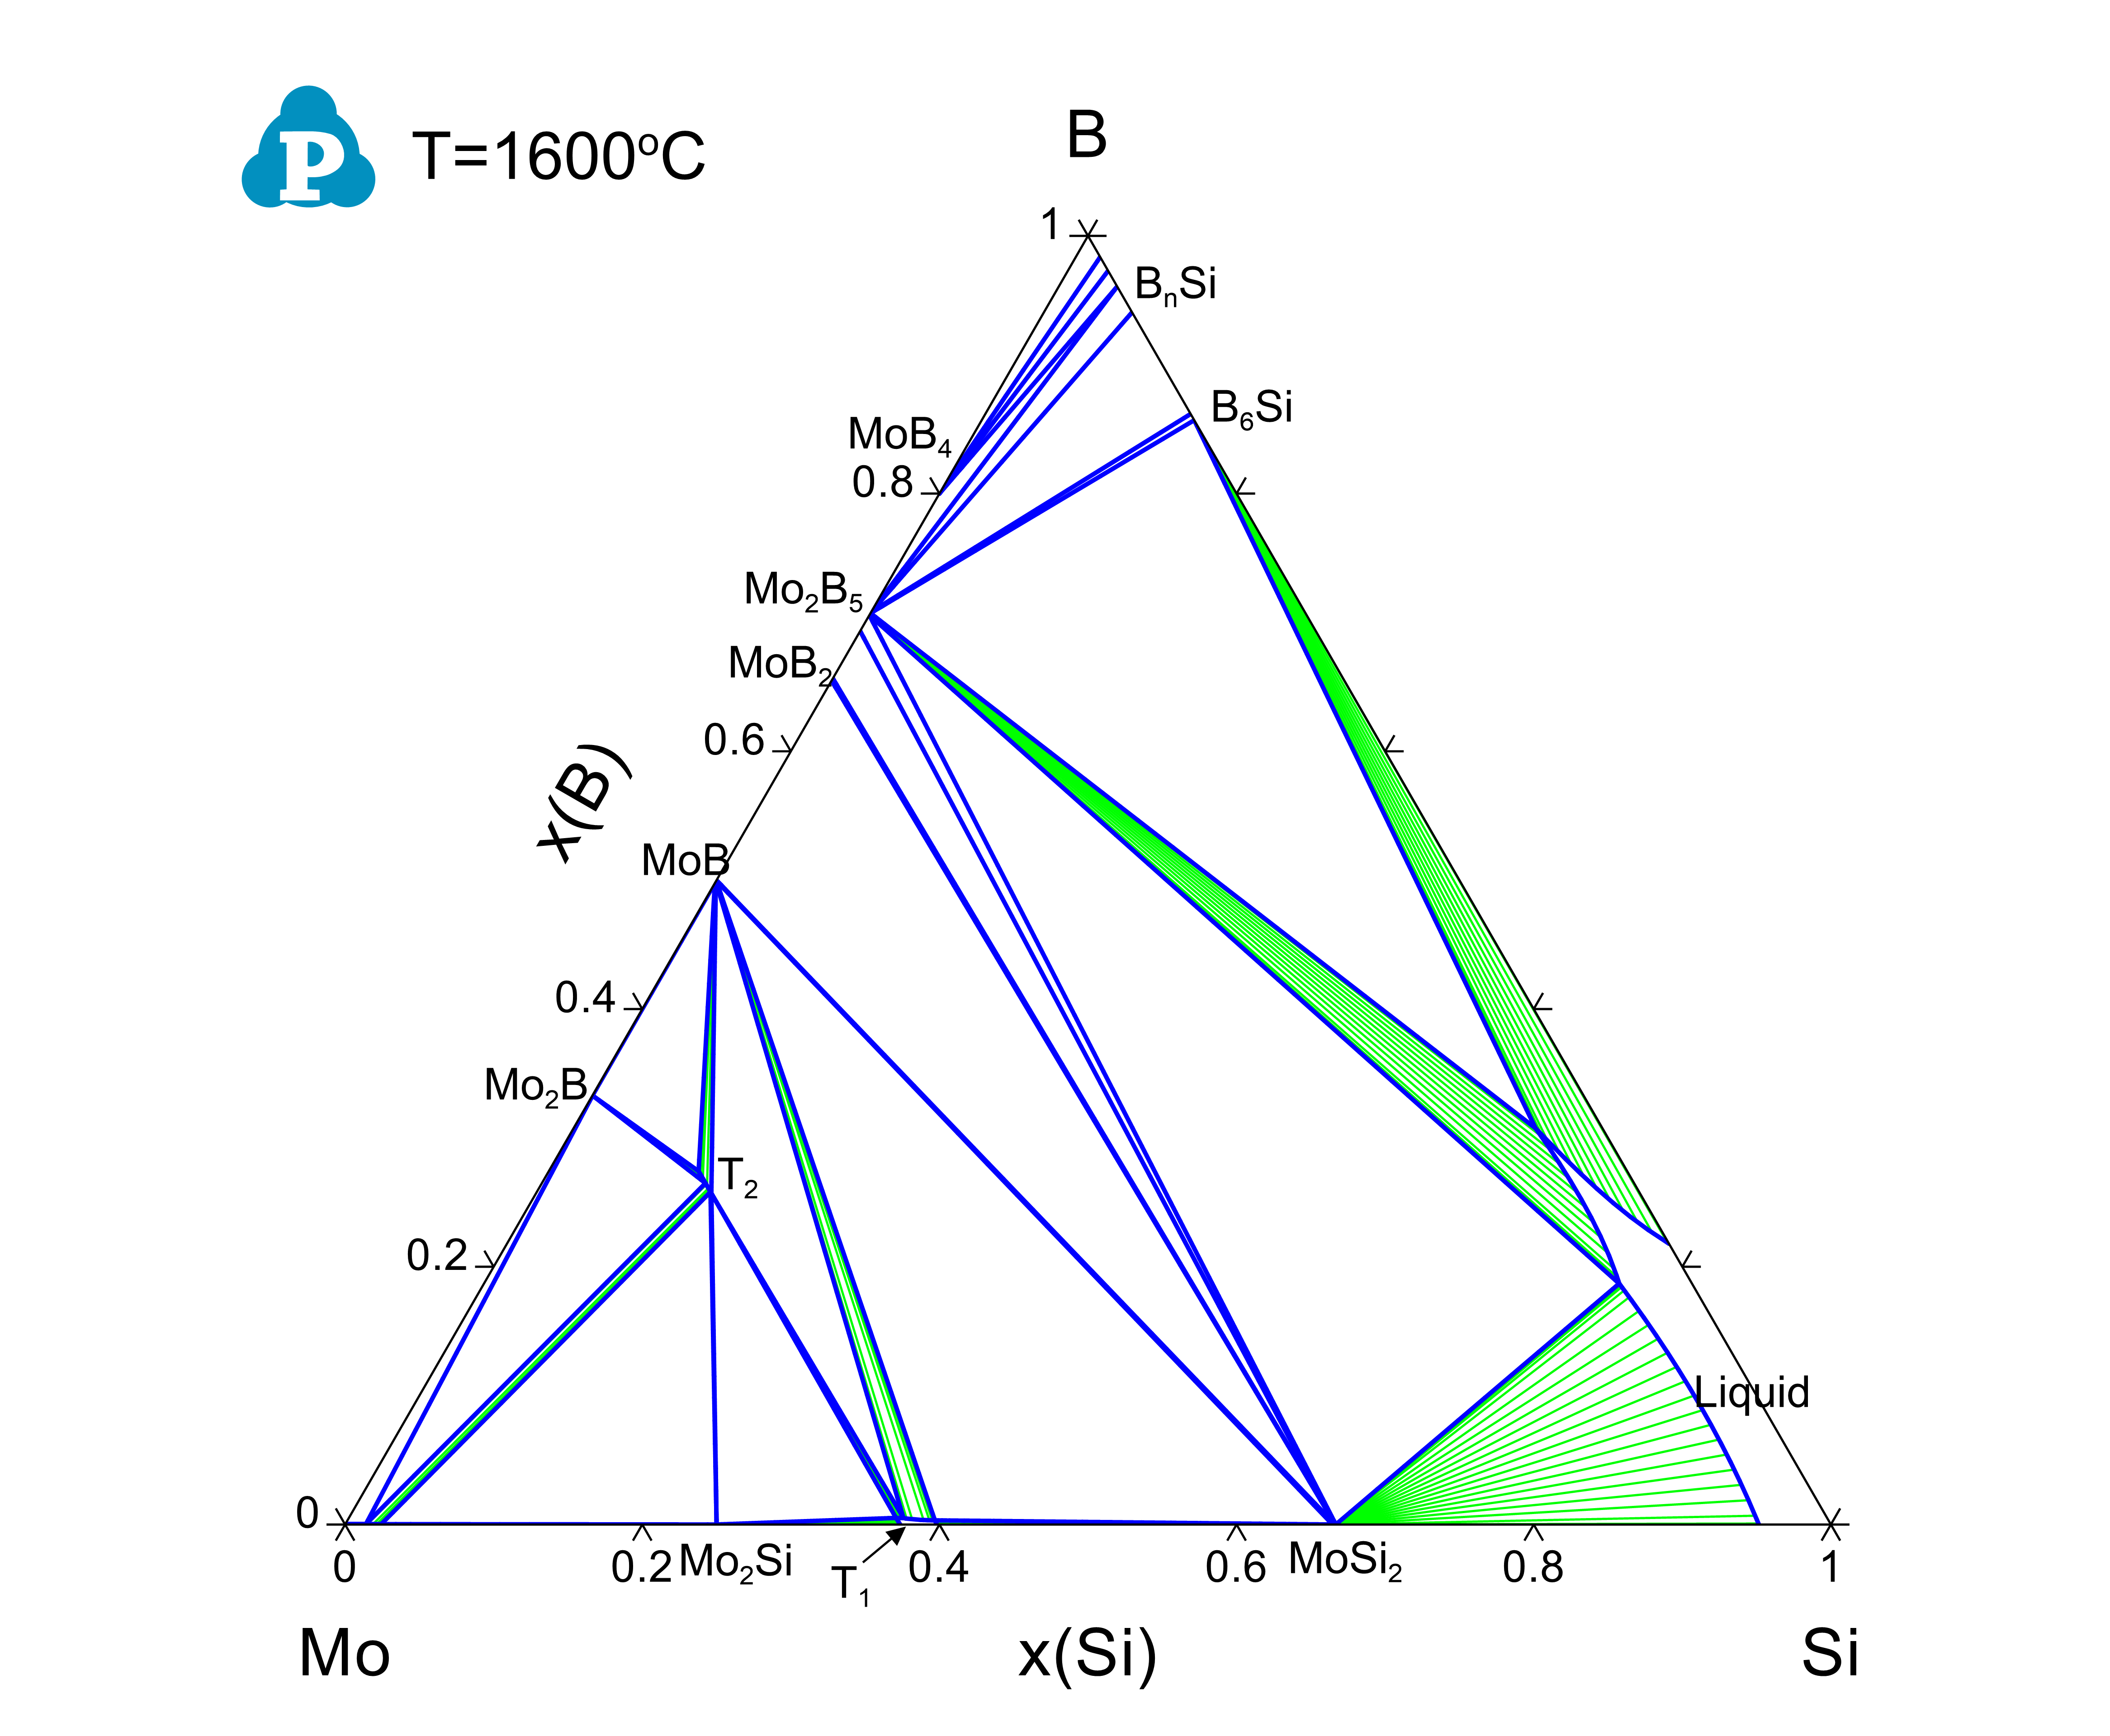
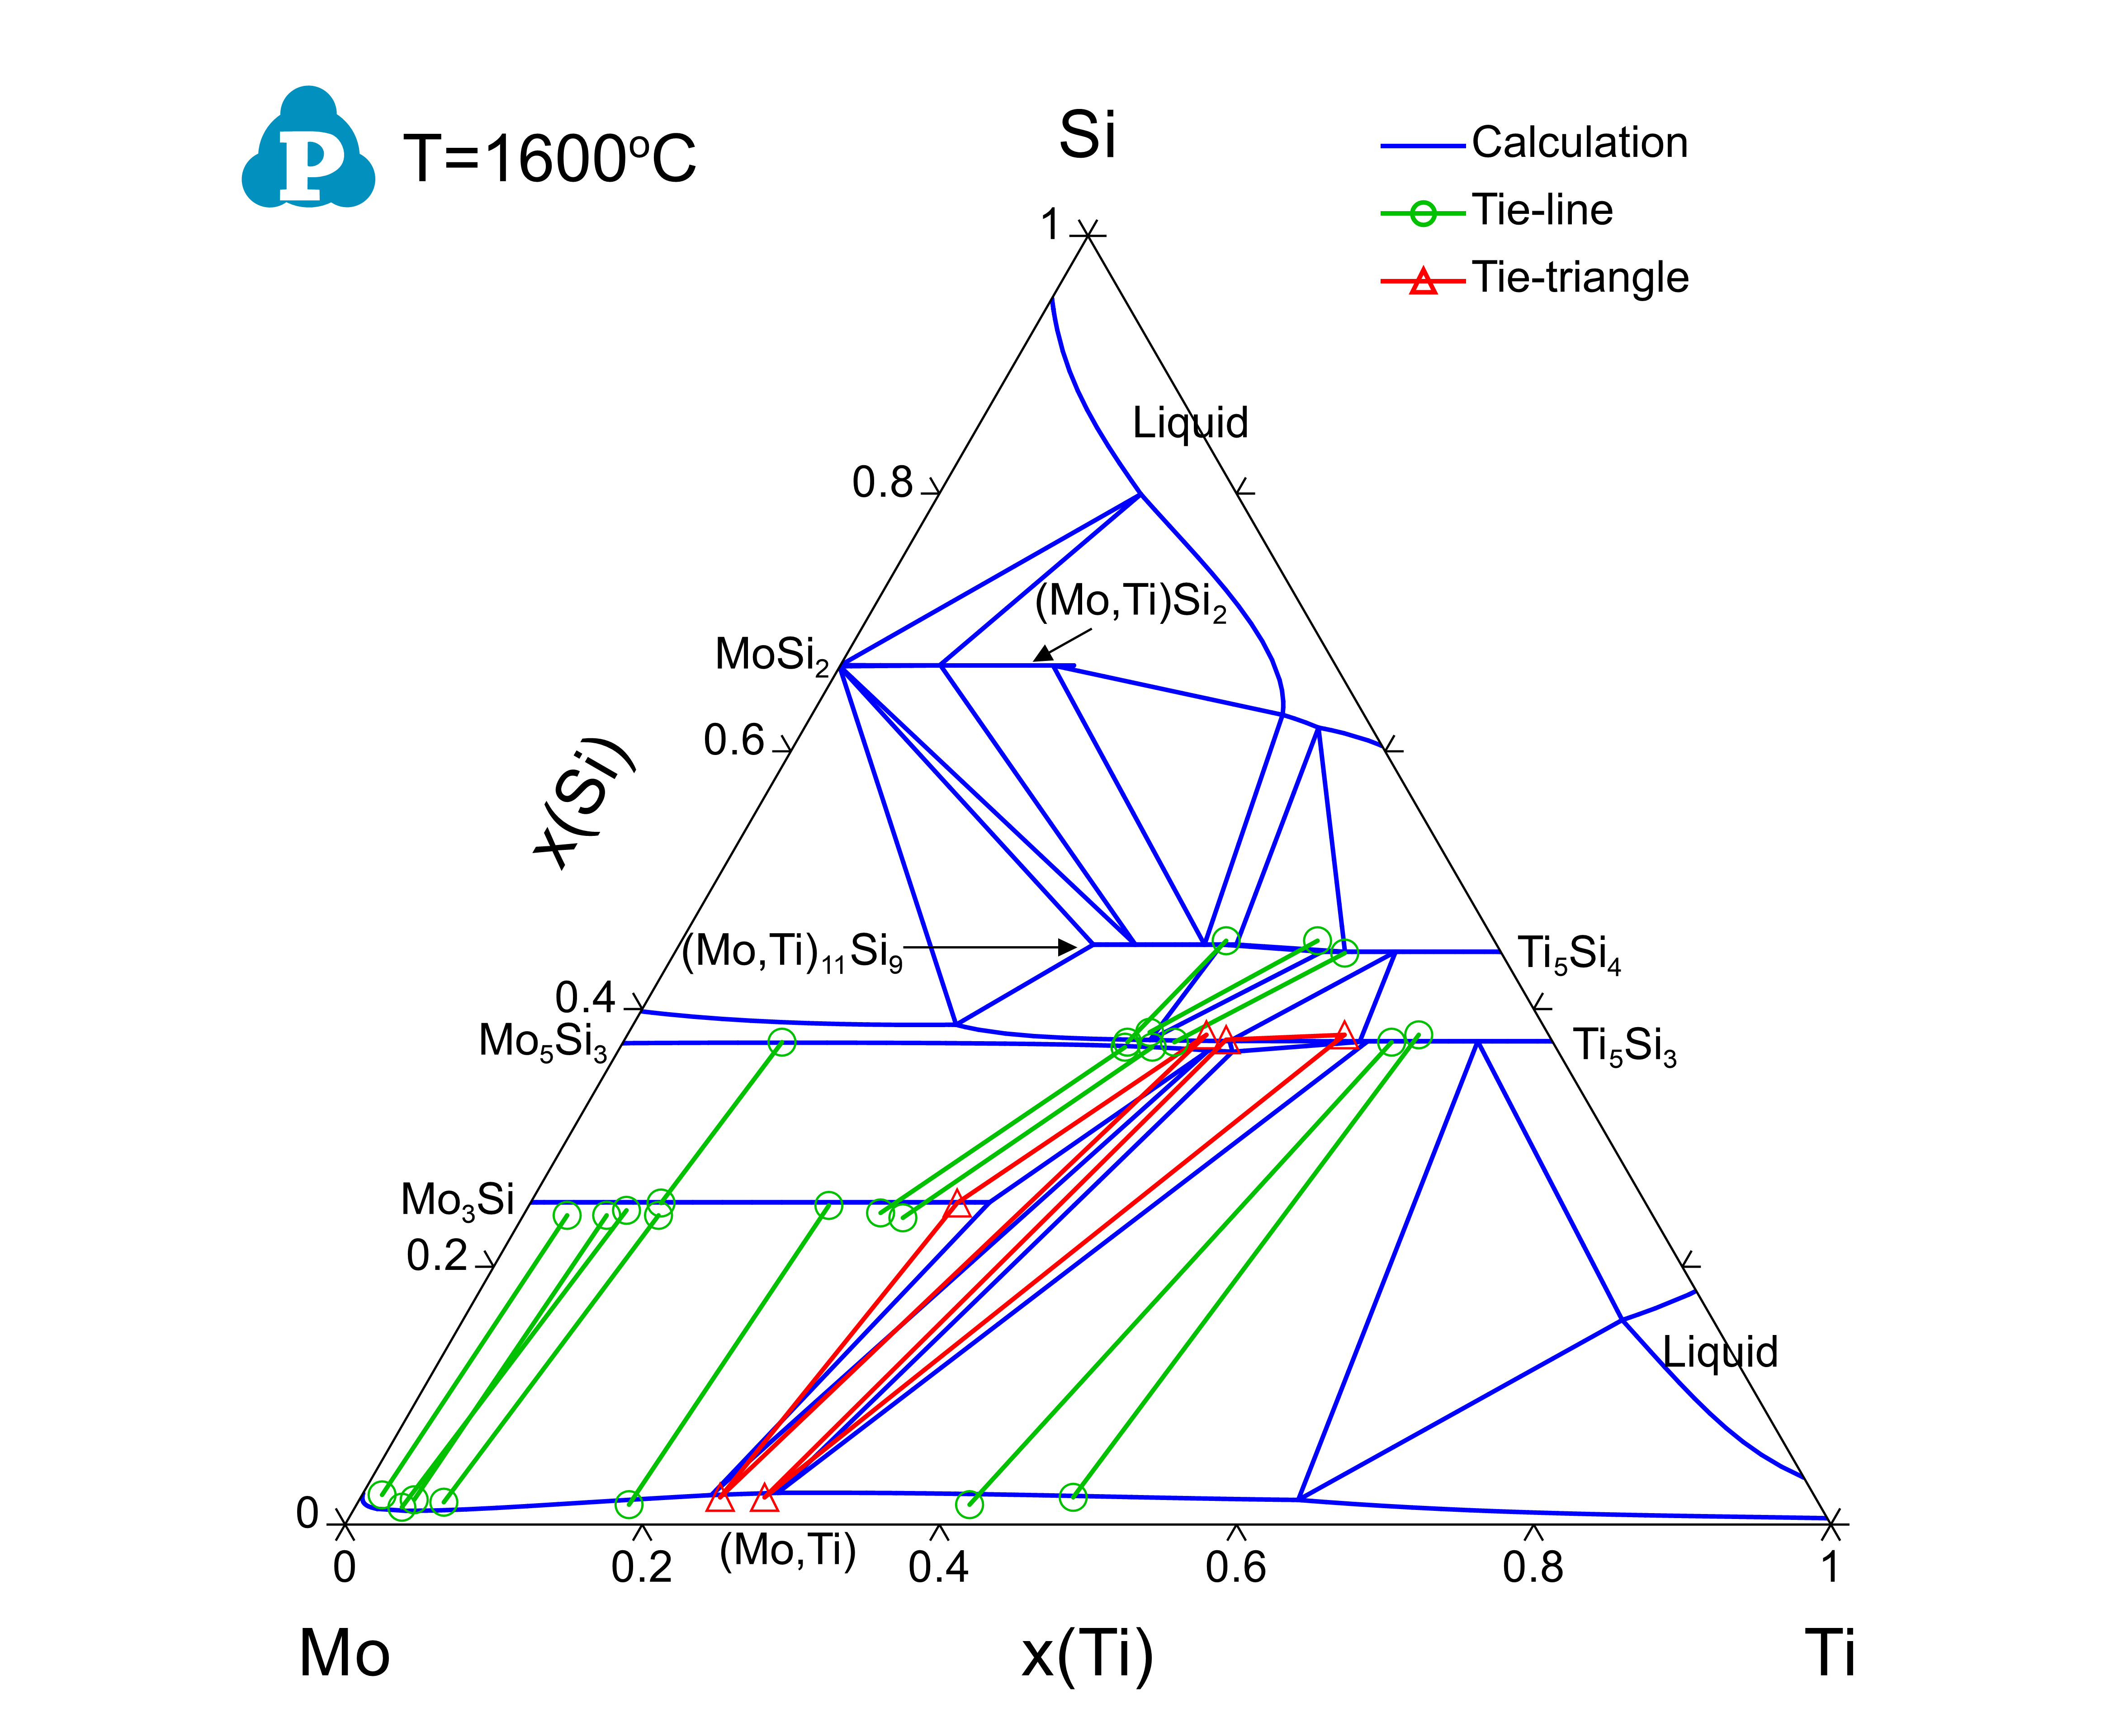
Figure 3: Calculated isothermal section of the Mo-Si-Ti ternary system at 1600 °C with experimental data of [2003Yan] plotted on it
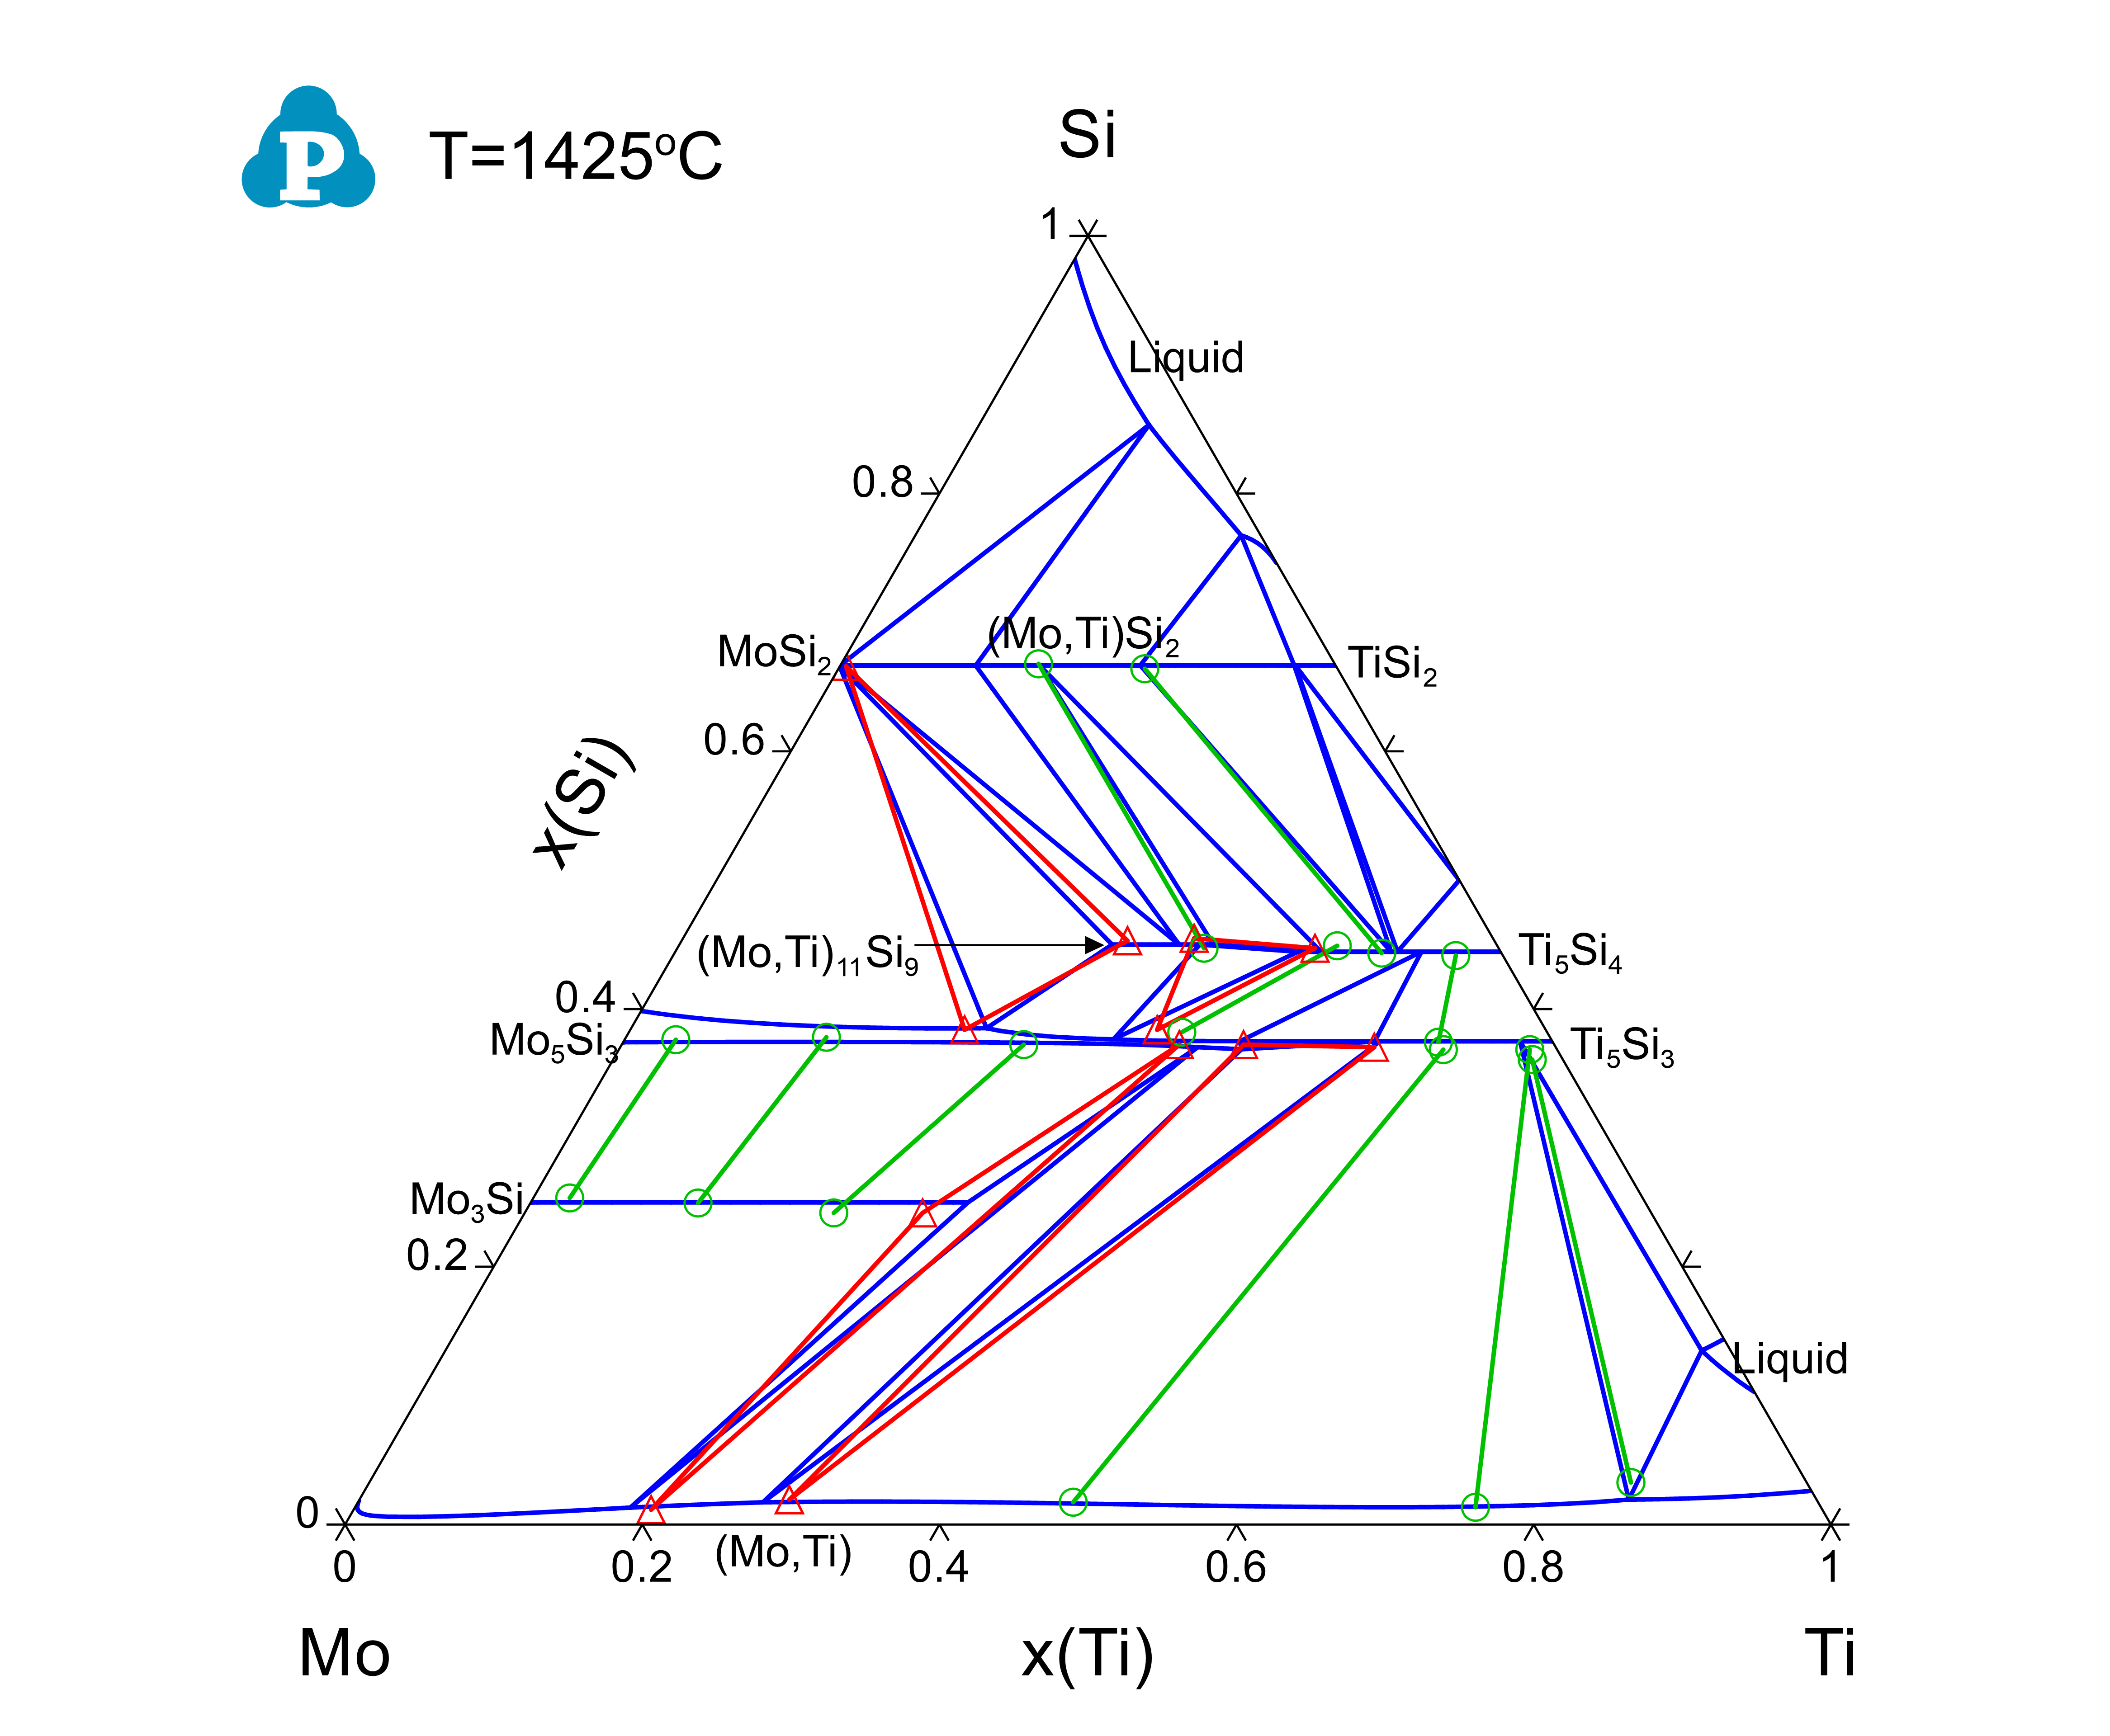
Figure 4: Calculated isothermal section of the Mo-Si-Ti ternary system at 1425 °C with experimental data of [2003Yan] plotted on it
In addition to the validation of phase equilibria, the current database has also been subjected to extensive validation of solidification data of commercial aluminum alloys. Figure 5 presents the calculated fraction of solid vs. temperature of the Mo-Si-Ti alloys as well as the solidification sequence using the Scheil model. The back scattered images of the as-cast microstructure of these Mo-Si-Ti alloys from [2003Yan] are also shown in the same figure. The predicated microstructures of the Mo-Si-Ti alloys using the Scheil model agree well with experimental observations.


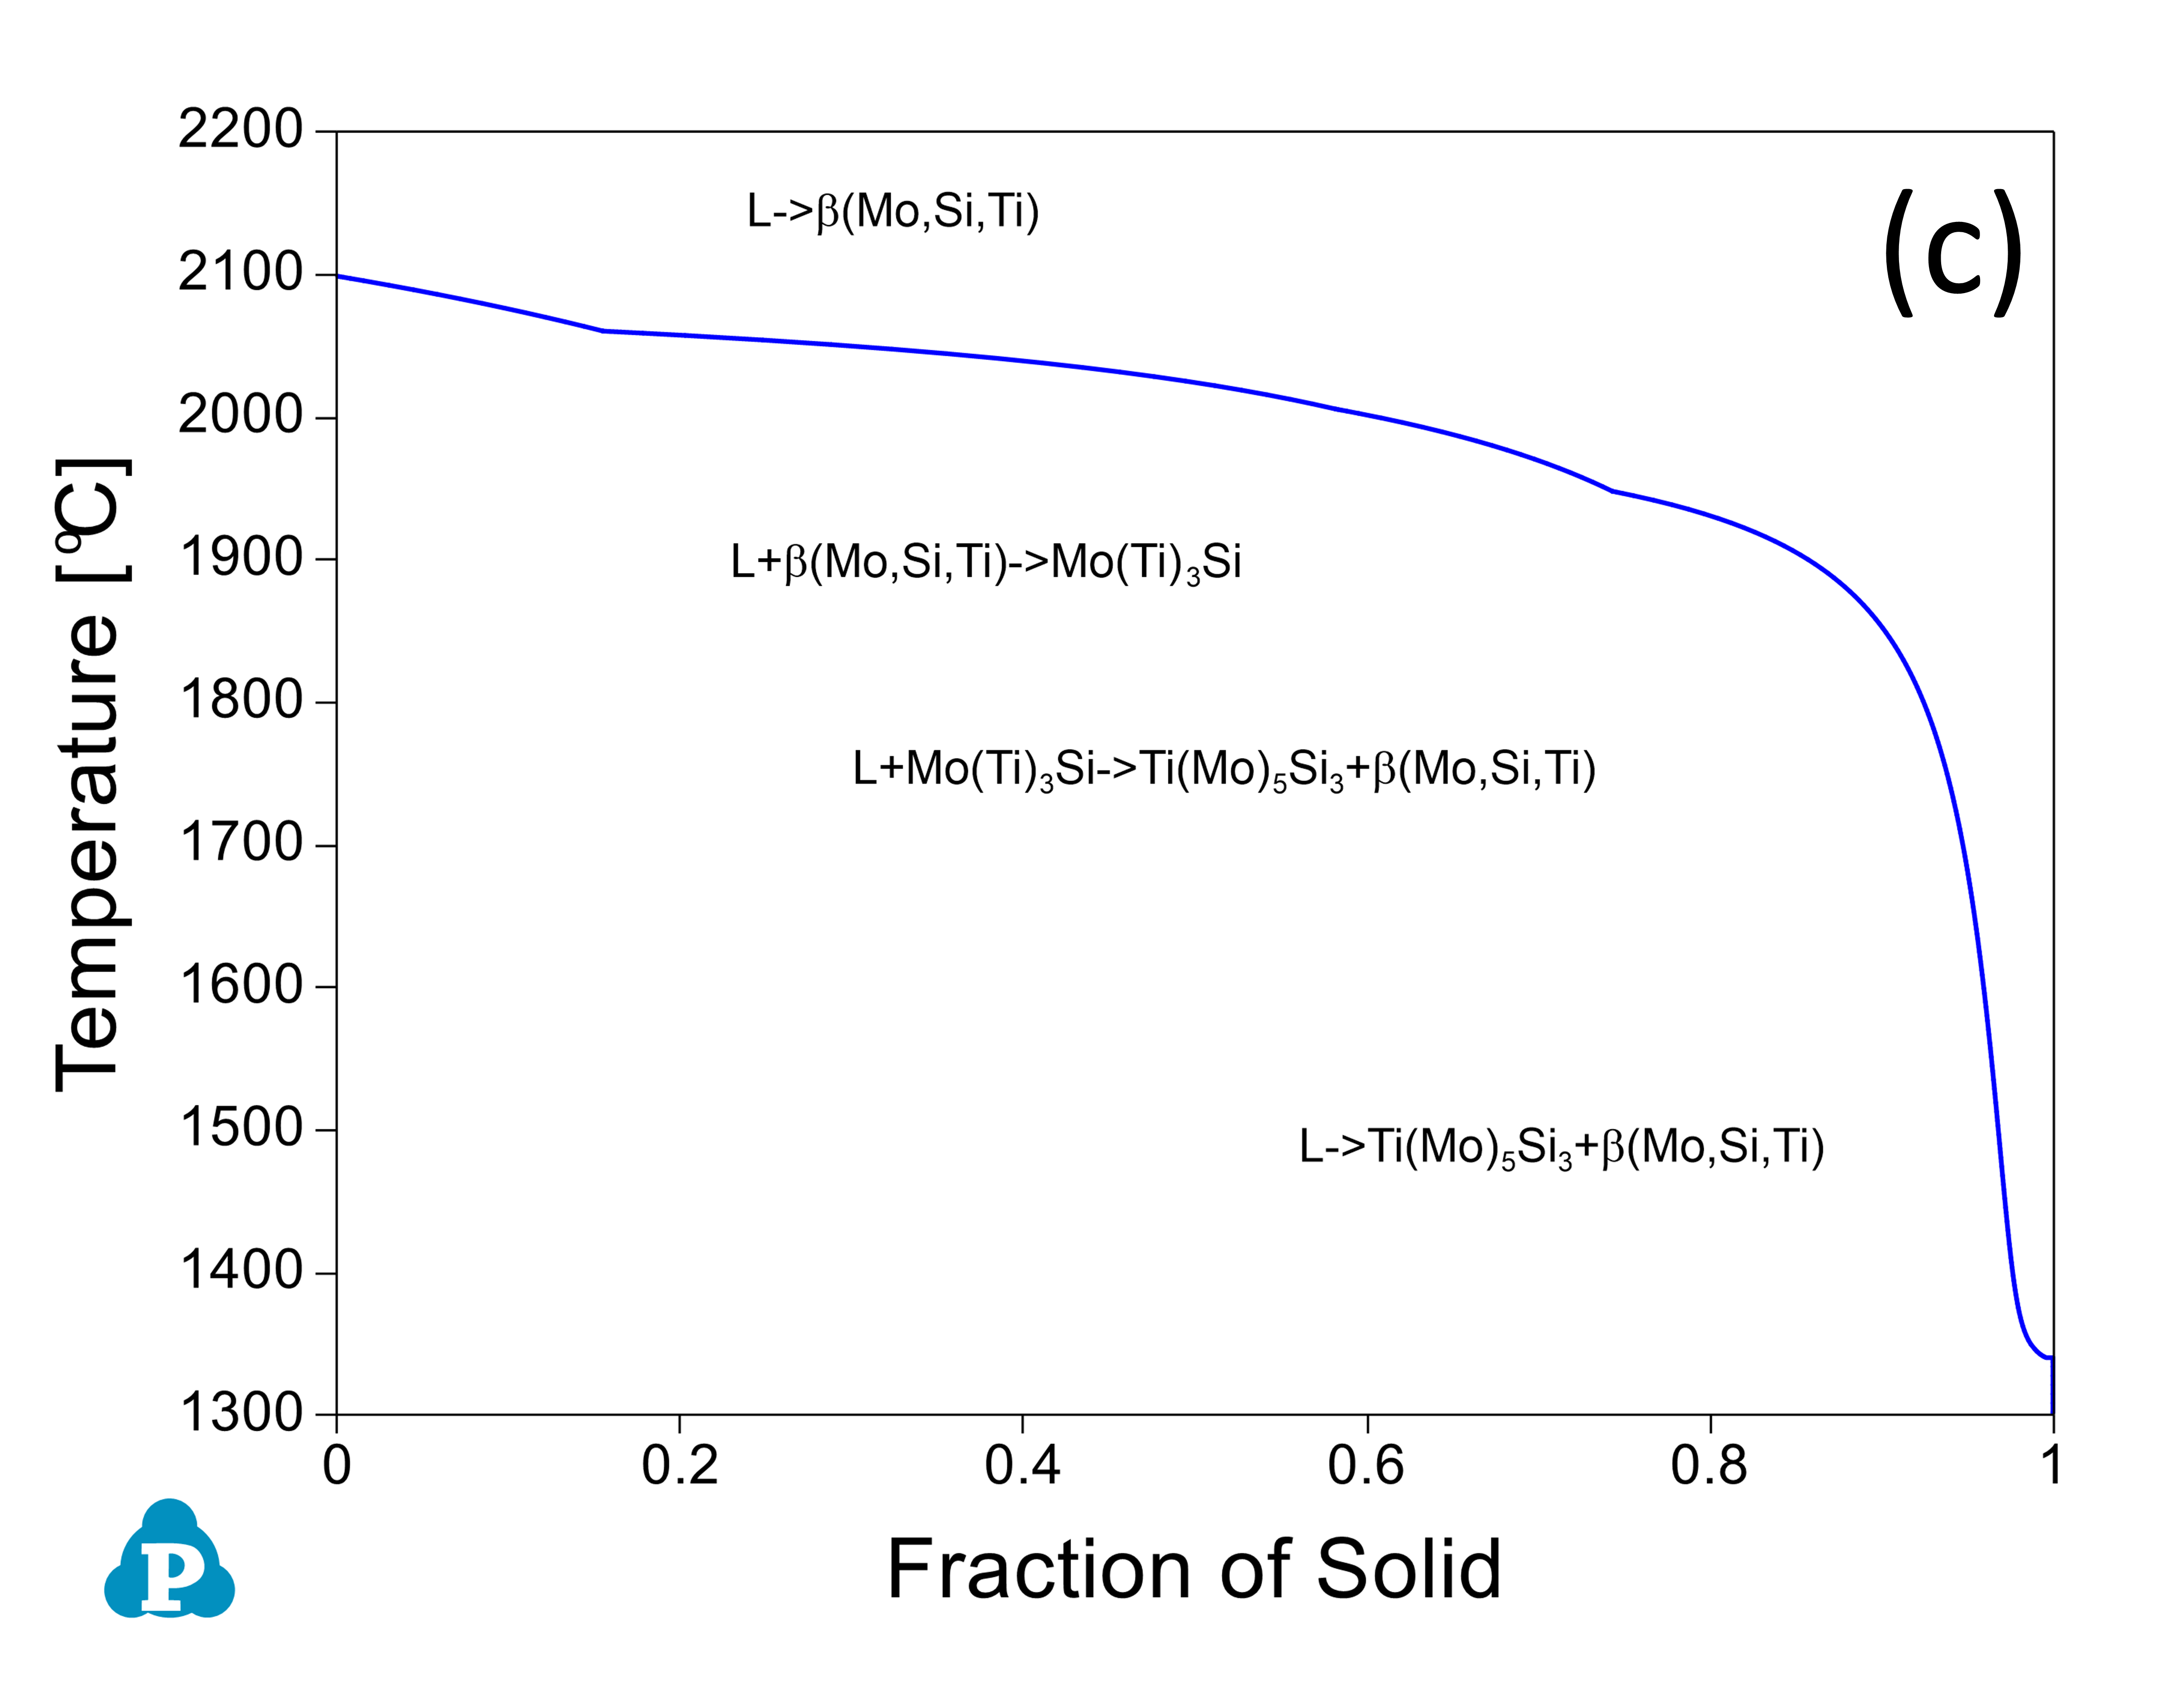

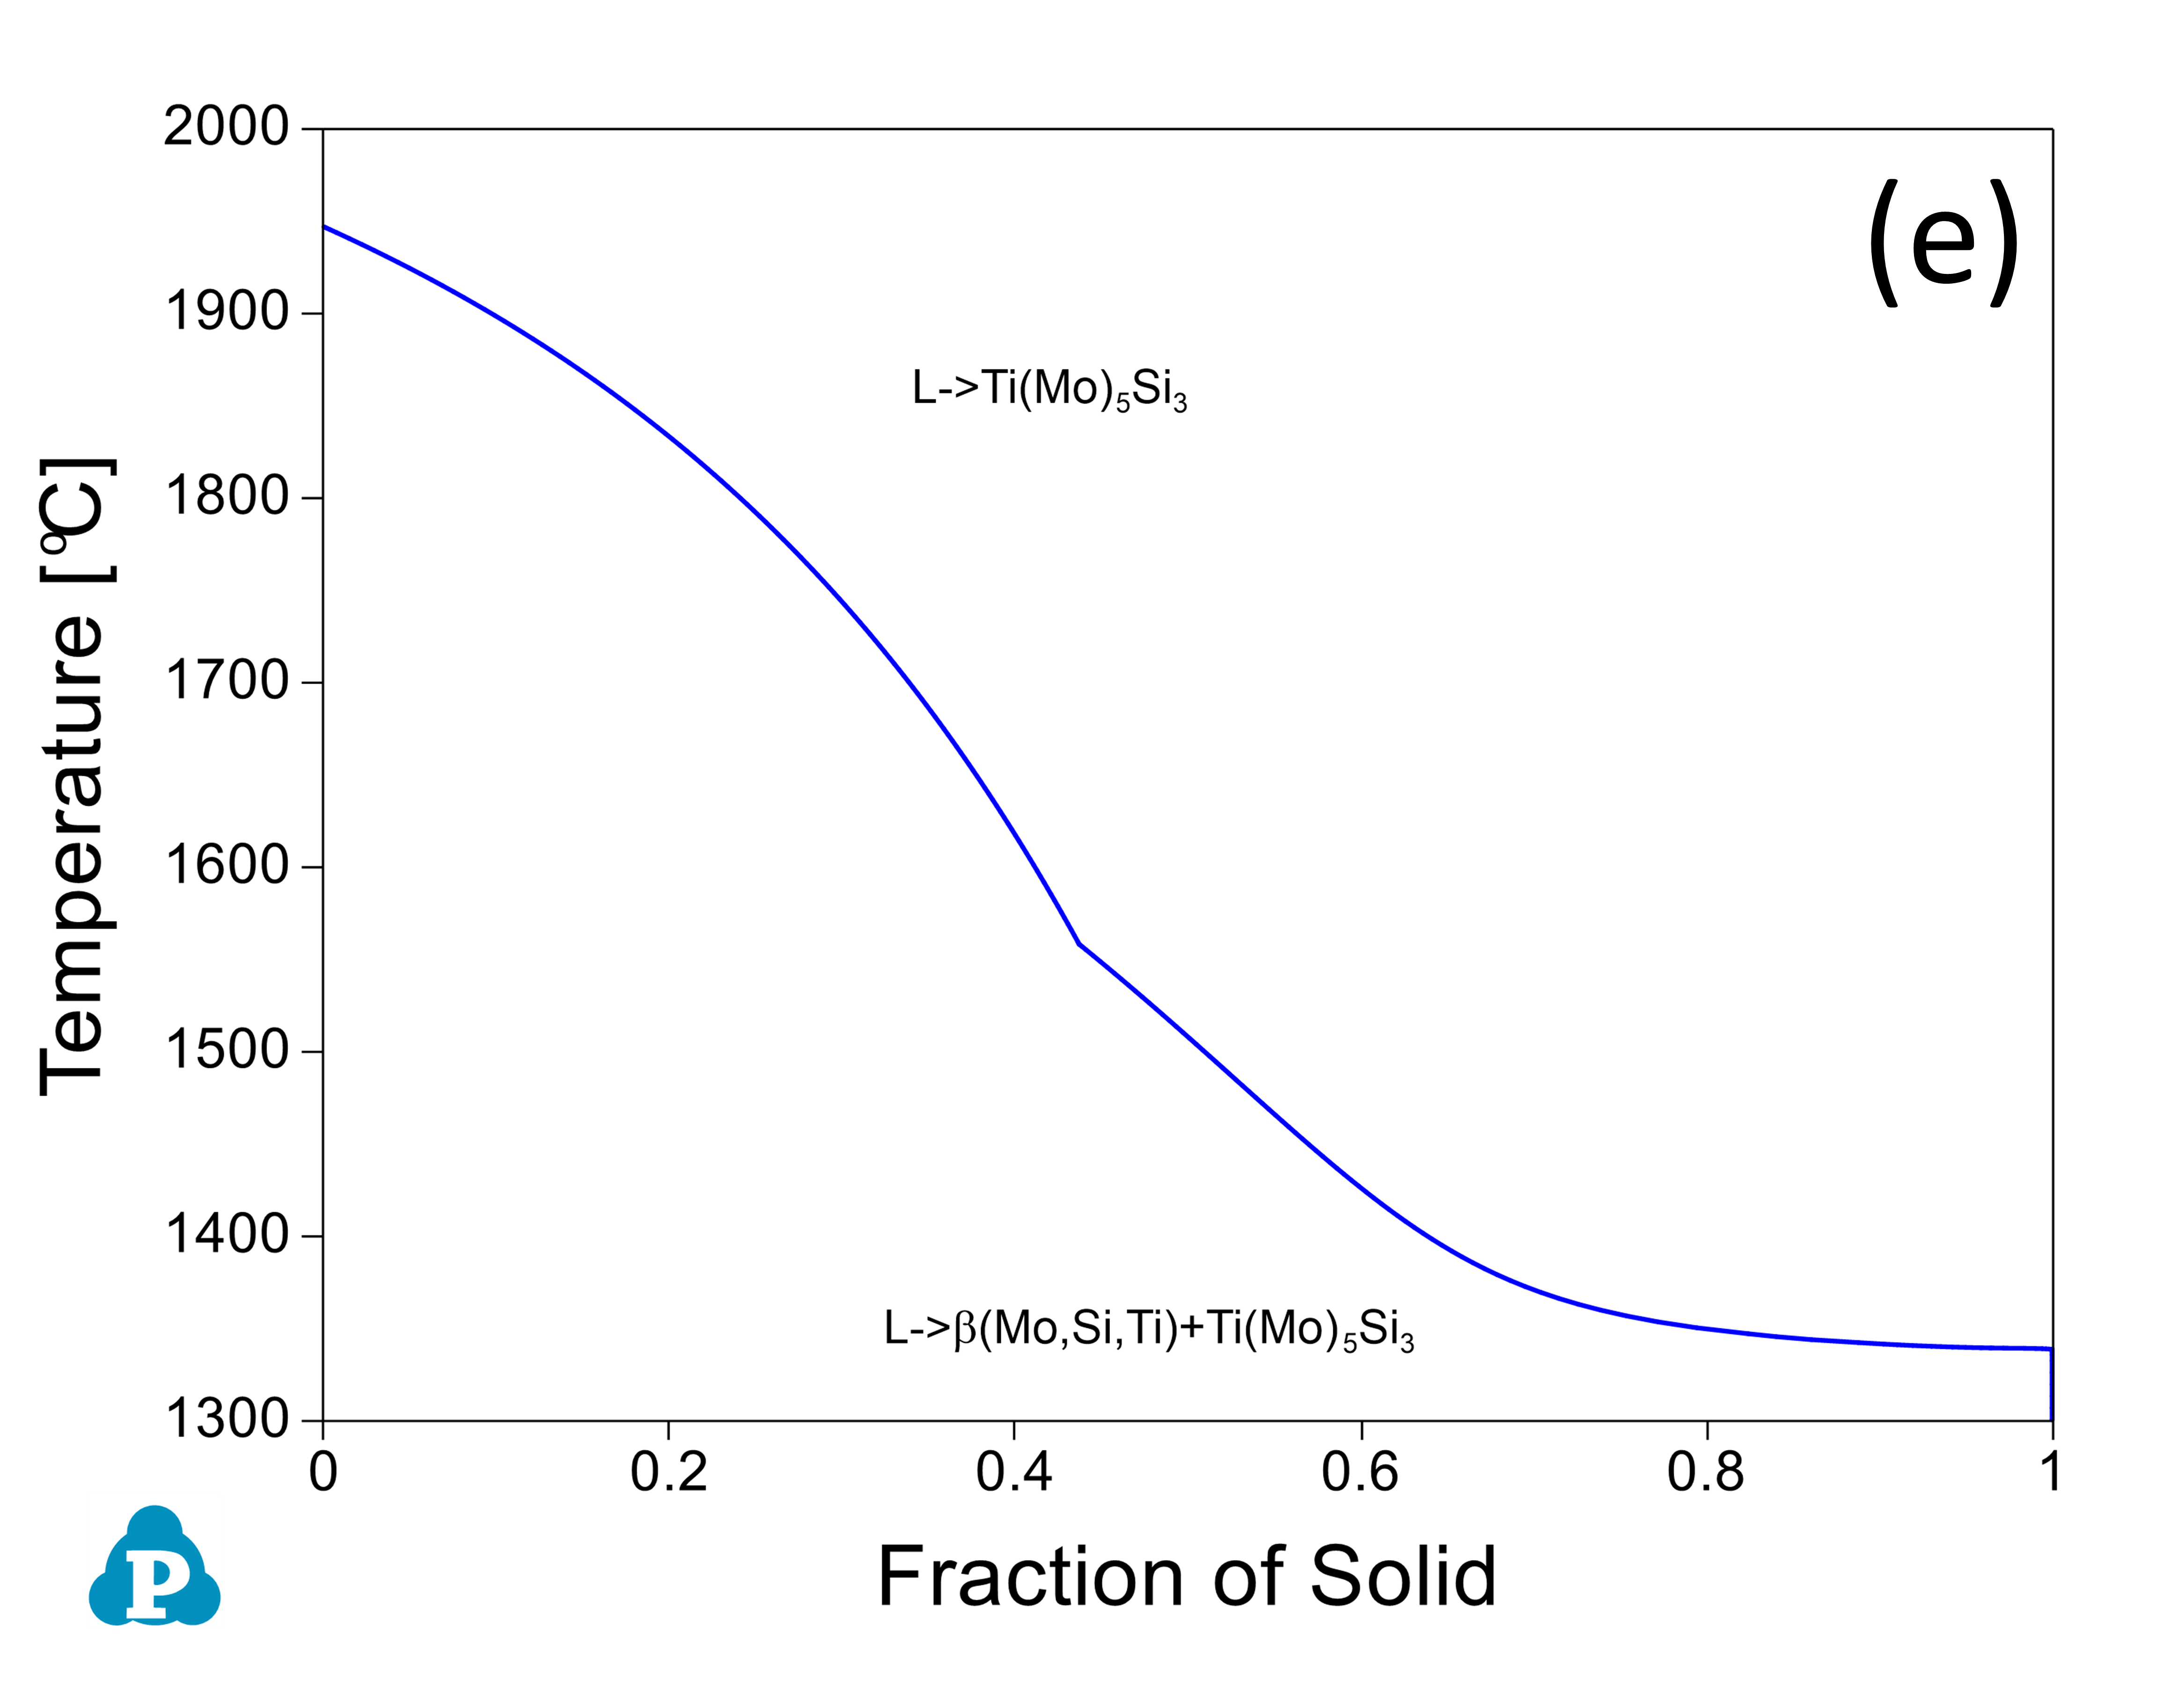

Figure 5: (a) Scheil simulation of solidification sequence of the Mo40Si20Ti40 alloy; (b): BSE image of the as-cast microstructure of the Mo40Si20Ti40 alloy; (c): Scheil simulation of the solidification sequence of the Mo40Si25Ti35 alloy; (d): BSE image of the as-cast microstructure of the Mo40Si25Ti35 alloy; (e): Scheil simulation of the solidification sequence of the Mo5Si25Ti70 alloy; (f): BSE image of the as-cast microstructure of the Mo5Si25Ti70 alloy
[2003Yan] Y. Yang, Y.A. Chang, L. Tan, Y. Du, Materials Science and Engineering A361 (2003) 281–293.